Executive Summary
i.
This Baseline Monitoring Report is to report baseline
findings for the Project of Outlying Islands Sewerage Stage 2 – South Lantau
Sewerage Works (Register No. AEIAR-210/2017) (hereinafter “Project”).
ii.
Baseline monitoring for existing landscape and
visual condition was conducted on 9 February 2021 to reconfirm the status of
Landscape Resources and Landscape Character Areas within works area.
iii.
In accordance with the EM&A Manual, baseline
noise monitoring was conducted at sixteen (16) monitoring stations for consecutive
14 days; while, baseline water monitoring was be carried out at nine (9)
monitoring stations, three days per week, for at least 4 weeks prior to the
commencement of construction works.
iv.
This report presents the findings and information of
baseline noise monitoring during the period from 2 March 2021 to 22 April 2021,
and those of baseline water quality monitoring during the period from 3 March
2021 to 29 March 2021. No construction activities under the Project were
undertaken during the baseline monitoring period.
Landscape and Visual Condition
v.
Compared to the findings in the approved EIA
report, the status of the LRs and LCAs covered in the works area of Contract
No. DC/2020/02 for the Project generally in line with the EIA report. Baseline
of other LR and LCA will be supplemented under separate submission(s) to
capture the baseline condition of the corresponding part(s) under other
contracts when corresponding work areas, detailed project works and landscape
design become available for review as per EM&A manual Section 9.
Noise Monitoring
vi.
The baseline noise levels established at sixteen (16)
monitoring stations are summarized as shown in Table I. Action & Limit levels
of baseline noise levels are summarized as shown in Table II.
Water Quality Monitoring
vii.
Average results and Action & Limit levels of baseline water quality
level at nine (9) stations are summarized as shown in Table III, Table IV, Table V and Table VI.
Table I Summary of
Baseline Noise Levels
|
Monitoring
Station ID
|
Monitoring
Station
|
0700-1900
hrs on normal weekdays
|
|
Leq
(30min), dB(A)
|
|
Average
|
Range
|
|
N01a *
|
Shui Hau Village
|
75.5
|
74.7 – 79.4
|
|
N01c *
|
Shui Hau Village
|
62.0
|
58.4 – 71.1
|
|
N03a *
|
Tong Fuk Village
|
74.9
|
73.2 – 78.0
|
|
N05a *
|
Residences at Cheung Fu Street
|
73.9
|
72.5 – 78.7
|
|
N07 *
|
Government Holiday Bungalows
|
58.3
|
54.6 – 71.9
|
|
N08 *
|
Cheung Sha Ha Tsuen
|
70.0
|
66.5 – 72.6
|
|
N10
|
Cheung Sha Sheung Tsuen
|
68.8
|
65.6 – 88.6
|
|
N11b *
|
San Shek Wan – Ming Garden
|
72.3
|
70.6 – 76.3
|
|
N12a *
|
Lo Uk Tsuen
|
73.3
|
71.3 – 75.0
|
|
N12b *
|
Lo Uk Tsuen
|
76.8
|
75.2 – 86.1
|
|
N13 *
|
Pui O San Wai Tsuen
|
73.6
|
70.5 – 77.5
|
|
N14
|
South Lantau Community Centre
|
62.2
|
57.3 – 74.3
|
|
N15b
|
Pui O Lo Wai Tsuen
|
70.7
|
62.4 – 78.7
|
|
N16a *
|
Residences at Ham Tin
|
68.1
|
63.9 – 75.2
|
|
N16b *
|
Residences at Ham Tin
|
68.5
|
64.1 – 80.5
|
|
N17
|
Bui O Public School
|
62.3
|
58.7 – 66.4
|
|
Remark:
Each of daily
30-minute sampling period includes six consecutive Leq (5min)
readings.
* Due to
free-field measurement, a correction factor of +3 dB(A) is adopted.
|
Table II Summary of
Action & Limit Levels of Baseline Noise Levels
|
Monitoring Station ID
|
Time Period
|
Parameter
|
Action Level
|
Limit Level
dB(A)
|
|
All
|
0700-1900 hrs on normal
weekdays
|
Leq, 30min
|
When one documented
complaint is received from any one of the noise sensitive receivers
Or
75dB(A)
recorded at the monitoring station
|
70dB(A) for school
And
65dB(A)
during examination period
|
Table III Summary of Baseline Water Quality Monitoring Results
|
Monitoring Station
|
DO
(mg/L)
|
DO
(mg/L)
|
|
Surface
and Middle
Layer
|
Bottom
Layer
|
|
Average
|
Range
|
Average
|
Range
|
|
CE
|
6.5
|
5.3 - 7.2
|
6.5
|
5.6 - 8.2
|
|
CF
|
6.6
|
5.9 - 7.4
|
6.4
|
5.9 - 7.2
|
|
SR4
|
6.4
|
5.6 - 7.1
|
6.3
|
5.8 - 7.5
|
|
SR5
|
6.4
|
5.8 - 7.2
|
6.3
|
5.8 - 7.1
|
|
SR6
|
6.3
|
5.5 - 7.2
|
6.4
|
6.4 - 6.4
|
|
SR9
|
6.5
|
5.6 - 7.2
|
6.4
|
5.5 - 6.9
|
|
SR10
|
6.5
|
5.8 - 7.3
|
6.3
|
6.2 - 6.4
|
|
SR12
|
6.6
|
5.9 - 7.5
|
-
|
-
|
|
SR15
|
6.4
|
5.7 - 7.9
|
-
|
-
|
Remark: “ – “
implies monitoring was conducted at middle layer only with respect to
corresponding water depth.
Table IV Summary of Baseline Water Quality Monitoring Results during Mid-flood Tide
|
Monitoring Station
|
Turbidity
(NTU)
|
SS (mg/L)
|
BOD5
(mg/L)
|
|
Average
|
Range
|
Average
|
Range
|
Average
|
Range
|
|
CE
|
6.1
|
1.8 - 14.6
|
3.9
|
1.3 - 13.7
|
1.3
|
0.6 - 2.9
|
|
CF
|
7.9
|
2.6 - 22.9
|
6.4
|
1.4 - 46.4
|
1.5
|
0.7 - 3.6
|
|
SR4
|
8.8
|
3.1 - 15.0
|
6.9
|
2.8 - 21.1
|
1.5
|
0.8 - 2.5
|
|
SR5
|
7.0
|
1.9 - 14.0
|
5.1
|
1.3 - 13.4
|
1.3
|
0.3 - 2.1
|
|
SR6
|
9.6
|
3.4 - 29.1
|
12.1
|
2.1 – 20.8
|
1.2
|
0.7 - 1.7
|
|
SR9
|
7.7
|
2.0 - 26.1
|
6.1
|
1.4 - 29.5
|
1.3
|
0.9 - 1.9
|
|
SR10
|
10.8
|
2.7 - 35.2
|
9.7
|
1.7 - 41.7
|
1.3
|
0.8 - 2.2
|
|
SR12
|
7.1
|
2.6 - 17.0
|
5.3
|
1.9 - 17.8
|
1.4
|
0.7 - 2.6
|
|
SR15
|
9.5
|
3.6 - 17.7
|
9.3
|
2.3 - 44.3
|
1.5
|
0.4 - 2.4
|
Table V Summary of Baseline Water Quality Monitoring Results during Mid-flood Tide
|
Monitoring Station & Depth
|
Total
Inorganic Nitrogen (mg/L)
|
Unionized Ammonia (mg/L)
|
E. coli (CFU per 100ml)
|
|
Average
|
Range
|
Average
|
Range
|
Average
|
Range
|
|
CE
|
0.14
|
0.01 -
0.25
|
0.003
|
0.001 -
0.006
|
3.4
|
1.0 - 56.0
|
|
CF
|
0.15
|
0.01 -
0.25
|
0.003
|
0.001 -
0.007
|
10.6
|
1.0 - 61.0
|
|
SR4
|
0.13
|
0.01 -
0.22
|
0.003
|
0.001 -
0.006
|
6.3
|
1.0 - 135.0
|
|
SR5
|
0.15
|
0.01 -
0.25
|
0.003
|
0.001 -
0.008
|
3.2
|
1.0 - 66.5
|
|
SR6
|
0.15
|
0.01 -
0.24
|
0.003
|
0.001 -
0.006
|
7.7
|
1.0 -
106.0
|
|
SR9
|
0.14
|
0.01 -
0.24
|
0.003
|
0.001 -
0.007
|
3.8
|
1.0 - 61.5
|
|
SR10
|
0.14
|
0.01 -
0.25
|
0.002
|
0.001 -
0.006
|
3.6
|
1.0 - 32.5
|
|
SR12
|
0.13
|
0.01 -
0.23
|
0.002
|
0.001 -
0.006
|
3.0
|
1.0 - 17.5
|
|
SR15
|
0.14
|
0.01 -
0.25
|
0.003
|
0.001 -
0.006
|
8.6
|
1.0 - 48.0
|
Table VI Summary of
Action & Limit Level of Baseline Water Quality
|
Parameters
|
Action
Level
|
Limit
Level
|
|
Construction
Phase Marine Water Monitoring
|
|
DO in mg/L B
|
Surface and Middle: 5.8 mg/L
Bottom: 5.9 mg/L
|
Surface and Middle: 4 mg/L
Bottom: 2 mg/L
|
|
Turbidity in NTU
(Depth-averaged A) C
|
14.4 NTU and
20% exceedance of value at any impact station compared with
corresponding data from control station D
|
23.5 NTU and
30% exceedance of value at any impact station compared with
corresponding data from control station D
|
|
SS in mg/L
(Depth-averaged A) C
|
13.1 mg/L and
20% exceedance of value at any impact station compared with corresponding
data from control station D
|
30.4 mg/L and
30% exceedance of value at any impact station compared with
corresponding data from control station D
|
|
Operation Phase Marine Water Monitoring
|
|
Dissolved oxygen in mg/L B
|
Surface and Middle: 5.8 mg/L
Bottom: 5.9 mg/L
|
Surface and Middle: 4 mg/L
Bottom: 2 mg/L
|
|
Turbidity in NTU (Depth-averaged A) C
|
14.4 NTU and
20% exceedance of value at any impact station compared with
corresponding data from control station D
|
23.5 NTU and
30% exceedance of value at any impact station compared with
corresponding data from control station D
|
|
SS in mg/L (Depth-averaged A) C
|
13.1 mg/L and
20% exceedance of value at any impact station compared with
corresponding data from control station D
|
30.4 mg/L and
30% exceedance of value at any impact station compared with
corresponding data from control station D
|
|
5-day Biochemical Oxygen Demand in mg/L (Depth-averaged A) C
|
2.2 mg/L and
20% exceedance of
value at any impact station compared with corresponding data from control
station D
|
5 mg/L E
|
|
Total Inorganic Nitrogen in mg/L (Depth-averaged A) C
|
0.23 mg/L
|
0.25
mg/L F
|
|
Unionized Ammonia in mg/L (Depth-averaged A) C
|
0.006 mg/L
|
0.021 mg/L G
|
|
E. coli
in cfu per 100 ml
(Depth-averaged
A) C
|
31.0 cfu per 100 ml L and
20% exceedance of
value at any impact station compared with corresponding data from control
station D
|
(i) 61.1 cfu per 100 ml, or 610 cfu/100mL as geometric mean for
secondary contact, recreation subzones H
(ii) 61.1 cfu per
100 ml, or 180 cfu/100mL as geometric mean for bathing
beach subzones H
|
|
Notes (with proposed amendments in AL/LL in underlined
text):
A. “Depth-averaged” is calculated by taking the
arithmetic means of reading of all three depths.
B. For DO, non-compliance of the water
quality limits occurs when monitoring result is lower than the limits.
C. For SS, turbidity, 5-day Biochemical Oxygen
Demand, Total Inorganic Nitrogen, Unionized Ammonia and E. coli,
non-compliance of the water quality limits occurs when monitoring result is
higher than the limits.
D. Action Level and Limit Level with 95%-ile / 99%-ile
derived from baseline data “and” 20% / 30% exceedance of control
station proposed in Section 5.1.1 justified with the sensitivity analysis of
control station criteria detailed in Section 3.8.2.
E. 99%-ile of baseline BOD5 data is 2.7
mg/L, which is considered too close to the proposed action level of 2.2 mg/L.
False alarm would be easily triggered if 2.7 mg/L is adopted as limit level.
Thus, 5 mg/L of criterion is adopted as limit level.
F. 99%-ile of baseline TIN data is 0.25 mg/L. Owing to
and-clause conditions, 0.25 mg/L is adopted as limit level.
G. 99%-ile of baseline UIA data is 0.006 mg/L, which
is same as the proposed action level. In order to avoid ambiguity of
triggering action and limit level, 0.021 mg/L is adopted as limit level
for effective implementation of event and action plan.
H. Referring to Table 4.1 of the EIA report, for
secondary contact recreation subzones, the level of Escherichia coli should
not exceed 610 per 100 milligrams per litre, calculated as the geometric mean
of all samples collected in one calendar year. While, for bathing beach
subzones, the level of Escherichia coli should not exceed
180 per 100 milligrams per litre, calculated as the geometric mean of
all samples collected from March to October inclusive in one calendar
year. Samples should be taken at least 3 times in a calendar
month at intervals of between 3 and 14 days.
|
1.1.1. The purpose of this Project is to
construct and operate a sewerage system for proper collection, treatment and
disposal of the sewage arising from South Lantau, which includes the areas
in Shui Hau, Tong Fuk, Cheung Sha,
San Shek Wan, Pui O and Ham Tin. Construction programme and Layout of
project site is presented in Figure 1.0
and Figure 1.1 respectively.
1.1.2.
The proposed Project would be implemented as follows:
(i)
Village
sewerage works: It comprises the provision of village sewerage to unsewered
villages of Shui Hau, Tong Fuk, Cheung Sha, San Shek Wan, Pui O and Ham Tin in
South Lantau. The works will involve construction of sewers inside villages’
alleys, which are then connected into the trunk sewerage system below.
(ii)
Trunk
sewerage works: It comprises the construction of trunk sewers, a total of six
(6) number of sewage pumping stations and the associated twin rising mains
along South Lantau Road for collection and conveyance of sewage from the
village sewerage system to the proposed San Shek Wan Sewage Treatment Works
(STW).
(iii)
San
Shek Wan STW and associated submarine outfall.
1.1.3.
The entire Project are divided into three contracts. Contract No.
DC/2020/20 (the Contract) would have the following
implementations as demonstrated in Figure 1.2 & Figure 1.3.
(i)
Construction
of a secondary sewage treatment works at San Shek Wan in South Lantau;
(ii)
Construction
of a sewage pumping station (SPS) at Pui O;
(iii)
Construction
of about 1.4 km of submarine outfall with a diameter of 350 mm for disposal of
treated effluent from the STW at San Shek Wan;
(iv)
Construction
of about 4.1 km of gravity sewers with diameters ranging from 150 mm to 375 mm
along South Lantau Road and Chi Ma Wan Road and at Pui O Lo Uk; and
(v)
Construction
of about 1.2 km of twin rising mains with a diameter of 200 mm along South
Lantau Road and Chi Ma Wan Road.
1.1.4.
Baseline
noise and water quality monitoring covers all contract areas in this report;
while, baseline condition of landscape resources and landscape character areas
only cover the area of Contract No. DC/2020/02. Baseline condition of other LR and LCA under other
contracts will be supplemented under separate submission(s).
1.1.5.
In
accordance with Condition 3.3 stated in the Environmental Permit (EP-538/2017),
four hard copies and one electronic copy of the Baseline Monitoring Report
shall be submitted to the Director at least 2 weeks before the commencement of
construction of the project.
1.1.6.
In
accordance with Section 12.1 of the Project Environmental Monitoring and Audit
(EM&A) Manual, the Baseline Environmental Monitoring Report should be
prepared and submitted within 10 days of completion of the baseline monitoring.
1.2.1.
Baseline monitoring is to review baseline conditions of noise level and
water quality along the Project boundary, and to establish baseline levels for
noise and water quality in accordance with the EM&A Manual. These levels
would be used as the basis for assessing environmental impact and compliance during
construction and operation stage of the Project. Baseline
conditions of landscape resources and landscape character areas are also
reviewed under this report to reconfirm the findings
in the approved EIA report (Register
No. AEIAR-210/2017).
1.2.2. This baseline monitoring report presents baseline
monitoring requirements, methodologies, monitoring
results and determination of action and limit levels for each monitoring
parameter at sixteen (16) noise monitoring stations and nine
(9) water quality monitoring stations.
2.1.1 In accordance with the EM&A Manual, baseline noise levels at sixteen (16)
monitoring stations shall be measured for a continuous period of at least 14
consecutive days at a minimum logging interval of 30 minutes during daytime
between 0700 and 1900 hours.
2.1.2 The baseline noise monitoring
at sixteen (16) monitoring stations were
conducted in three batches separately during the monitoring period from 2 March
2021 to 22 April 2021 and the relevant findings are summarized in this report.
The baseline monitoring schedule is shown in Appendix A.
2.2.1 Noise monitoring was
performed using sound level meter at the designated monitoring location. Sound
level meters shall comply with the International Electrotechnical Commission
Publications 651:1979 (Type 1) and 804:1985 (Type 1) specifications. Acoustic
calibrator shall be deployed to check the sound level meters at a known sound
pressure level. Brand and model of the
equipment is given in Table 2.1.
Table 2.1 Noise Monitoring Equipment
|
Equipment
|
Brand and
Model
|
Series Number
|
|
Integrated Sound Level Meter
|
Larson Davis LxT
|
4797
6307
6344
6345
6346
6357
|
|
Acoustic Calibrator
|
Larson Davis Cal 200
|
13437
|
2.2.2 Calibration certificates of
the noise monitoring equipment are attached in Appendix B.
3.1
2.3.1 In order to prevent from
potential disturbances to others and facilitate noise monitoring works, fine
adjusted monitoring location was therefore proposed. The fine adjusted noise
monitoring stations for baseline noise monitoring are presented in Table 2.2
and shown in Appendix C.
Table 2.2 Baseline
Noise Monitoring
Stations
|
Monitoring
Station ID (1)
|
Monitoring
Location
|
Measurement Type
|
Level
(in terms
of
no. of floor)
|
|
N01a
|
Shui
Hau Village
|
Free-Field
|
G/F
|
|
N01c
|
Shui
Hau Village
|
Free-Field
|
G/F
|
|
N03a
|
Tong
Fuk Village
|
Free-Field
|
G/F
|
|
N05a
|
Residences
at Cheung Fu Street
|
Free-Field
|
G/F
|
|
N07
|
Government
Holiday Bungalows
|
Free-Field
|
G/F
|
|
N08
|
Cheung
Sha Ha Tsuen
|
Free-Field
|
G/F
|
|
N10
|
Cheung
Sha Sheung Tsuen
|
Façade
|
G/F
|
|
N11b
|
San
Shek Wan – Ming Garden
|
Free-Field
|
G/F
|
|
N12a
|
Lo Uk
Tsuen
|
Free-Field
|
G/F
|
|
N12b
|
Lo Uk
Tsuen
|
Free-Field
|
G/F
|
|
N13
|
Pui O
San Wai Tsuen
|
Free-Field
|
G/F
|
|
N14
|
South
Lantau Community Centre
|
Façade
|
G/F
|
|
N15b
|
Pui O
Lo Wai Tsuen
|
Façade
|
G/F
|
|
N16a
|
Residences
at Ham Tin
|
Free-Field
|
G/F
|
|
N16b
|
Residences
at Ham Tin
|
Free-Field
|
G/F
|
|
N17
|
Bui O
Public School
|
Façade
|
R/F
|
Remarks (1): Fine
adjustment of noise monitoring stations at all locations was proposed as per EP
Condition 3.1.
3.2
2.4.1 Monitoring parameters,
frequency and duration of noise monitoring are summarized in Table 2.3.
Table 2.3 Baseline
Noise Monitoring Parameters, Frequency and Duration
|
Monitoring
Period
|
Duration
|
Measurement Parameter
|
Measurement Period
|
Frequency
|
|
Baseline Monitoring
|
Continuous period of at least 14 consecutive days
|
A-weighted levels Leq, L10 and L90
Including 30 minutes (six consecutive Leq(5min) readings)
|
Between 0700 and 1900
hours
|
Daily
|
3.3
2.5.1 Monitoring Procedure
(a)
Façade and free-field measurements were made at corresponding
monitoring locations. For free-field measurement, a correction factor of +3 dB
(A) would be applied.
(b)
The battery condition was checked to ensure the
correct functioning of the meter.
(c)
Parameters such as frequency weighting, the time
weighting and the measurement time were set as follows:
(i)
Frequency weighting: A time weighting: Fast
(ii)
Time measurement: Daily measurement of
A-weighted levels Leq, L10 and L90 shall be
conducted for a continuous period of at least 14 consecutive days at a minimum
logging interval of 30 minutes. Daily measurement periods should be between
0700 and 1900 hours (six consecutive Leq(5min) readings).
(d)
Prior and after to the noise measurement, the
meter was checked using the acoustic calibrator for 94dB (A) at 1000 Hz. If the
difference in the calibration level before and after measurement was more than
±1.0dB(A), the measurement would be considered invalid and repeat of noise
measurement would be required after re-calibration or repair of the equipment.
2.5.2 Maintenance and Calibration
(a)
The microphone head of the sound level meter was
cleaned with soft cloth at regular intervals.
(b)
The sound level meter and calibrator were calibrated
at yearly intervals.
2.6.1 Baseline noise monitoring was
carried out from 2 March 2021 to 22 April 2021 in three batches for recording two-week
monitoring data and the weather were mostly fine and cloudy. During the
baseline monitoring period, no construction activities were observed. The major
noise source was traffic noise and community noise near the monitoring station.
2.6.2 The baseline noise monitoring
results are summarized in Table 2.4 respectively. Detailed noise
monitoring results are presented in Appendix D.
Table 2.4 Summary of Baseline Noise Monitoring Results
|
Monitoring Station
|
0700-1900 hrs on normal weekdays
|
|
Leq (30min), dB(A)
|
|
Average
|
Range
|
|
N01a *
|
75.5
|
74.7
– 79.4
|
|
N01c *
|
62.0
|
58.4
– 71.1
|
|
N03a *
|
74.9
|
73.2
– 78.0
|
|
N05a *
|
73.9
|
72.5
– 78.7
|
|
N07 *
|
58.3
|
54.6
– 71.9
|
|
N08 *
|
70.0
|
66.5
– 72.6
|
|
N10
|
68.8
|
65.6
– 88.6
|
|
N11b *
|
72.3
|
70.6
– 76.3
|
|
N12a *
|
73.3
|
71.3
– 75.0
|
|
N12b *
|
76.8
|
75.2
– 86.1
|
|
N13 *
|
73.6
|
70.5
– 77.5
|
|
N14
|
62.2
|
57.3
– 74.3
|
|
N15b
|
70.7
|
62.4
– 78.7
|
|
N16a *
|
68.1
|
63.9
– 75.2
|
|
N16b *
|
68.5
|
64.1
– 80.5
|
|
N17
|
62.3
|
58.7
– 66.4
|
|
Remark:
Each of daily 30-minute sampling period includes
six consecutive Leq (5min) readings.
* Due to free-field measurement, a correction
factor of +3 dB(A) is adopted.
|
3.4
3.5
2.7.1 Action and Limit Levels of
noise monitoring have been set in accordance with the criteria specified in the
EM&A Manual as shown in Table 2.5 below.
Table 2.5 Action and Limit Levels for Construction Noise
|
Monitoring Station
|
Action Level
|
Limit Level
|
|
All
|
When one documented complaint is received from any
one of the noise sensitive receivers
Or
75dB(A) recorded at the monitoring station
|
70 dB(A) for
school
And
65dB(A)
during examination period
|
3
WATER QUALITY MONITORING
3.1
Monitoring Requirements
1.
1.1.
1.1.1.
3.1.1 In accordance with the Project EM&A
Manual, the measurements shall be taken at all designated monitoring stations
including control stations, for three times a week at mid-ebb and mid-flood
tides for 4 consecutive weeks during prior to the commencement of the
construction works. The interval between 2 sets of monitoring should not be
less than 36 hours. Replicate in-situ measures should be carried out in each
sampling event. The levels of dissolved oxygen (DO), turbidity, salinity and pH
shall be measured in situ, while suspended solids (SS), 5-day biochemical oxygen
demand (BOD5), total inorganic nitrogen (TIN), unionized ammonia (UIA)
and E.coli shall be determined by laboratory analysis at all the
designated monitoring stations. Water samples shall be extracted at 1m below
surface, 1m above seabed and at the mid-depth level at where the water depth is
at least 6m. If the water depth is less than 3m, water samples shall only be
collected at the mid-depth level. For stations with depth less than 6m, the
mid-depth sample can be omitted.
3.1.2 The baseline water quality monitoring was
conducted during the baseline monitoring period from 3 March 2021 to 29 March 2021 and the relevant findings are summarized in this report. The baseline monitoring
schedule is shown in Appendix A.
3.2
Monitoring Equipment
1.1.2.
3.2.1 The baseline water quality monitoring was
performed using Multifunctional Meter and Turbid Meter at each designated
monitoring station. They are capable of measuring:
(a)
a dissolved oxygen level in the range of 0-20mg/L
and 0-200% saturation (Detection Limit: 0.1mg/L)
(b)
a temperature of 0-45 degree Celsius (Detection Limit: 0.1 degree Celsius)
(c)
turbidity level between 0-1000NTU (Detection
Limit: 0.1NTU)
(d)
salinity in the range of 0-40ppt (Detection Limit:
0.1ppt)
(e)
pH value in range of 0.0 – 14.0 (Detection Limit:
0.1units)
Other monitoring equipment namely water depth meter, water current
meter, dGPS positioning device, water sampler listed below were also deployed,
(a)
Water depth meter (Range: 0.6 -100m, Resolution: 0.1m)
(b)
Water current meter (Range: 0-360o, Detection Limit: 1mm/s)
(c)
dGPS positioning device (Resolution: Horizontal: 0.25m; Vertical: 0.50 m
)
(d)
Water sampler (Horizontal discrete type, Capacity: 2.2L)
3.2.2 Brand and model of the equipment are given
in Table 3.1.
Table 3.1 Water Quality Monitoring Equipment
|
Equipment
|
Brand and model
|
Series Number
|
|
Multifunctional Meter
|
Sonde YSI Professional Plus
|
17F100236
|
|
Turbid meter
|
Xin Rui WGZ-3B
|
1807079
|
3.2.3 Calibration certificates of the water
quality monitoring equipment are attached in Appendix B.
3.3
Monitoring Locations
3.3.1 Water quality monitoring stations for
baseline water quality monitoring are presented in Table 3.2 and shown in Appendix E.
Table 3.2 Details of Baseline Water
Quality Monitoring
Stations
|
Station
|
Description
|
Easting
|
Northing
|
|
CE
|
Upstream control station at ebb tide
|
810900
|
807690
|
|
CF
|
Upstream control station at flood tide
|
815720
|
807980
|
|
SR4 (1)
|
Ecological Sensitive Receiver (Coral Communities) at Pui O Wan
|
814938
|
810975
|
|
SR5
|
Ecological Sensitive Receiver (Coral Communities) at Pui O Wan
|
814326
|
810540
|
|
SR6
|
Gazetted Bathing Beach at Lower Cheung
Sha
|
810553
|
810475
|
|
SR9 (1)
|
Ecological Important Stream at Tong Fuk
|
811325
|
809787
|
|
SR10
|
Secondary Contact Recreational Zones at South Lantau
|
810561
|
809494
|
|
SR12 (1)
|
Proposed Special Site of Scientific Interest (SSSI)
at Shui Hau Wan
|
810359
|
808989
|
|
SR15
|
Gazetted Bathing Beach at Pui O and Ecologically Important Stream at Pui O
|
816037
|
810722
|
Remarks (1): Fine
adjustment of water quality monitoring stations at SR4, SR9 and SR12 was
proposed as per EP Condition 3.1, and baseline monitoring was conducted at corresponding
fine adjusted locations.
3.4
Monitoring Parameters,
Frequency and Duration
1.1.3.
3.4.1 Monitoring parameters, frequency and
duration of water quality monitoring are summarized in Table 3.3.
3.4.2
The levels of DO, temperature, turbidity and salinity shall be measured
in situ while SS, BOD5, TIN, UIA and E.coli shall be
determined by laboratory analysis at all the designated monitoring stations.
3.4.3
In association with the water quality parameters, other relevant data
shall also be recorded, such as monitoring location / position, time, pH, DO
saturation, weather conditions, and any special phenomena underway near the
monitoring station.
Table 3.3 Water Quality Monitoring Parameters and
Frequency
|
Monitoring Period
|
Duration
|
Sampling Parameter
|
Frequency
|
Remarks
|
|
Baseline
Monitoring
|
at least 4 weeks
prior to the commencement of construction works
|
DO, temperature,
turbidity, salinity, SS, BOD5, TIN, UIA and E.coli
|
three days per
week
|
Duplicate samples for in-situ
measurements and laboratory analysis
|
1.1.4.
3.5.1 Monitoring Procedure
(a)
The condition near the monitoring stations shall be observed and
recorded on the data log sheet.
(b)
Check of sensors and electrodes with certified standard solutions
before each use.
(c)
Wet bulb calibration for a DO meter should be carried out before
measurement.
(d)
Water depth should be recorded by detector before sampling.
(e)
Sample would be taken using water sampler at surface, middle and
bottom level.
(f)
Transfer the sampled water carefully into cleaned water bottles
provided by the laboratory at the spot after the collection of the water sample
for the subsequent laboratory testing of SS, BOD5, TIN, UIA and E.coli.
(g)
Transfer the sampled water from the bucket sampler to the rinsed
water container for in-situ measurement (In case of the in-situ measurement
cannot be carried at spot due to safety and adverse weather condition, sampled
water will be transfer to cleaned water bottles provided by laboratory. Then,
In-situ measurement will be conducted at a safe location which sampled water
inside cleaned water bottle will be transfer to the rinsed water container for
in-situ measurement) In-situ measurement shall be measured in duplicate.
(h)
Parameters including Water Temperature (℃ ),
pH (units), Salinity (ppt), DO (mg/L), DO saturation (%) will be measured by
the Multifunctional Meter and Turbidity (NTU) will be measured by turbid meter.
(i)
Record the result on the data log sheet and record
any special finding during / after in-situ measurement.
(j)
The water sample bottles will store in a cool box,
which shall be delivered to HOKLAS laboratory for further testing to determine
the level of SS, BOD5, TIN, UIA and E.coli.
3.6.1 Maintenance and Calibration
(a)
The responses of sensors and electrodes of the
water quality monitoring equipment were cleaned and checked at regular
intervals.
(b)
DO meter (Multifunctional Meter) and turbid meter
was certified by a laboratory accredited under HOKLAS or any other
international accreditation scheme, and subsequently re-calibrated at 3 monthly
intervals throughout all stages of the water quality monitoring as per Section
3.2.7 in Appendix-D2: General Technical Requirements of Environmental
Monitoring of Guidelines for Development Projects in Hong Kong and typical
EM&A requirements of current projects with water quality monitoring (e.g.
Expansion of Hong Kong International Airport into a Three-Runway System, Tung
Chung New Town Extension), which recommended 3 monthly intervals calibration.
3.6.2 Decontamination Procedures
Water sampling equipment used during the course of the monitoring
programme was decontaminated by manual washing and rinsed clean seawater/distilled
water after each sampling event. All disposable equipment was discarded after
sampling.
3.6.3 Laboratory measurement
Analysis of SS, BOD5, TIN, UIA and E.coli.
will be conducted by a HOKLAS accredited laboratory, which is ALS
Technichem (HK) Pty. Ltd.
3.6.4 Quality Control Measures implemented by
ALS Technichem (HK) Pty. Ltd
(a)
Reporting limit of SS, BOD5, TIN, UIA and E.coli.
are 1.0 mg/L, 0.1 mg/L, 0.01 mg/L, 0.001mg/L and 1.0 CFU per 100ml,
respectively.
(b)
Water samples were collected and stored in
appropriate sampling bottles. All procedures in testing of the water samples
were in accordance with our standard procedures as set in QA/QC procedures of
the HOKLAS laboratory.
(c)
QC samples comprise those which monitor and
control the laboratory performance namely Laboratory Control Sample (LCS),
Duplicate Control Sample (DCS), Method Blanks and those which are used for data
assessment and the evaluation of matrix effects by using Surrogates, Matrix
Spike (MS), Matrix Spike Duplicate (MSD) and Sample Duplicates.
(d)
Quality control samples such as Laboratory Blanks
and Quality Control Sample, and/or Certified Reference Materials (CRM) are run
at a frequency of 1 in 20 per 'lot' of samples. Sample Duplicates and Matrix
Spikes are run at a frequency of 1 in 20 or 1 per batch, whichever is more
frequent.
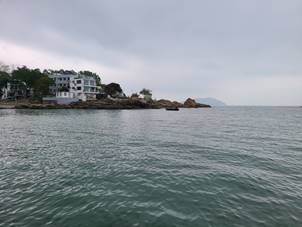
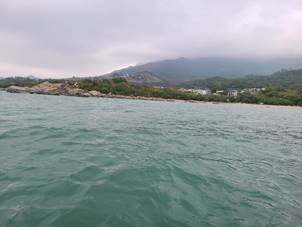
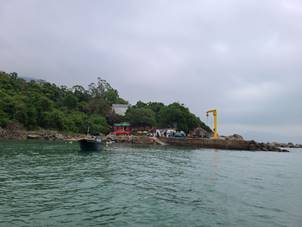
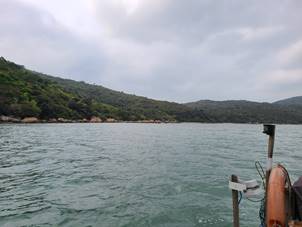
3.7.1 The baseline water quality monitoring was carried out from 3 March 2021 to 29
March 2021 and the weather was mostly fine and sometimes cloudy. Representative photos of the site condition during
baseline monitoring are shown in Table
3.7. During the baseline monitoring period, no
construction activities were observed.
3.7.2 The baseline water quality monitoring
results are summarized in Table 3.4, Table
3.5 and Table 3.6. Detailed water quality monitoring results and record of
wind data from Hong Kong Observatory are presented in Appendix F.
Table 3.4 Summary
of Baseline DO Monitoring Results
|
Monitoring
Station
|
DO (mg/L)
|
DO (mg/L)
|
|
Surface and Middle
Layer
|
Bottom Layer
|
|
Average
|
Range
|
Average
|
Range
|
|
CE
|
6.5
|
5.3
- 7.2
|
6.5
|
5.6
- 8.2
|
|
CF
|
6.6
|
5.9
- 7.4
|
6.4
|
5.9
- 7.2
|
|
SR4
|
6.4
|
5.6
- 7.1
|
6.3
|
5.8
- 7.5
|
|
SR5
|
6.4
|
5.8
- 7.2
|
6.3
|
5.8
- 7.1
|
|
SR6
|
6.3
|
5.5
- 7.2
|
6.4
|
6.4
- 6.4
|
|
SR9
|
6.5
|
5.6
- 7.2
|
6.4
|
5.5
- 6.9
|
|
SR10
|
6.5
|
5.8
- 7.3
|
6.3
|
6.2
- 6.4
|
|
SR12
|
6.6
|
5.9
- 7.5
|
-
|
-
|
|
SR15
|
6.4
|
5.7
- 7.9
|
-
|
-
|
Remark: “ – “ implies monitoring was conducted at middle layer only with
respect to corresponding water depth.
Table 3.5 Summary
of Baseline Turbidity, SS & BOD5 Monitoring Results
|
Monitoring
Station
|
Turbidity (NTU)
|
SS
(mg/L)
|
BOD5 (mg/L)
|
|
Average
|
Range
|
Average
|
Range
|
Average
|
Range
|
|
CE
|
6.1
|
1.8
- 14.6
|
3.9
|
1.3
- 13.7
|
1.3
|
0.6
- 2.9
|
|
CF
|
7.9
|
2.6
- 22.9
|
6.4
|
1.4
- 46.4
|
1.5
|
0.7
- 3.6
|
|
SR4
|
8.8
|
3.1
- 15.0
|
6.9
|
2.8
- 21.1
|
1.5
|
0.8
- 2.5
|
|
SR5
|
7.0
|
1.9
- 14.0
|
5.1
|
1.3
- 13.4
|
1.3
|
0.3
- 2.1
|
|
SR6
|
9.6
|
3.4
- 29.1
|
12.1
|
2.1
- 20.8
|
1.2
|
0.7
- 1.7
|
|
SR9
|
7.7
|
2.0
- 26.1
|
6.1
|
1.4
- 29.5
|
1.3
|
0.9
- 1.9
|
|
SR10
|
10.8
|
2.7
- 35.2
|
9.7
|
1.7
- 41.7
|
1.3
|
0.8
- 2.2
|
|
SR12
|
7.1
|
2.6
- 17.0
|
5.3
|
1.9
- 17.8
|
1.4
|
0.7
- 2.6
|
|
SR15
|
9.5
|
3.6
- 17.7
|
9.3
|
2.3
- 44.3
|
1.5
|
0.4
- 2.4
|
Table 3.6 Summary
of Baseline TIN, UIA & E. Coli Monitoring Results
|
Monitoring
Station & Depth
|
Total Inorganic Nitrogen (mg/L)
|
Unionized
Ammonia (mg/L)
|
E.
coli (CFU per 100ml)
|
|
Average
|
Range
|
Average
|
Range
|
Average
|
Range
|
|
CE
|
0.14
|
0.01
- 0.25
|
0.003
|
0.001
- 0.006
|
3.4
|
1.0
- 56.0
|
|
CF
|
0.15
|
0.01
- 0.25
|
0.003
|
0.001
- 0.007
|
10.6
|
1.0
- 61.0
|
|
SR4
|
0.13
|
0.01
- 0.22
|
0.003
|
0.001
- 0.006
|
6.3
|
1.0
- 135.0
|
|
SR5
|
0.15
|
0.01
- 0.25
|
0.003
|
0.001
- 0.008
|
3.2
|
1.0
- 66.5
|
|
SR6
|
0.15
|
0.01
- 0.24
|
0.003
|
0.001
- 0.006
|
7.7
|
1.0
- 106.0
|
|
SR9
|
0.14
|
0.01
- 0.24
|
0.003
|
0.001
- 0.007
|
3.8
|
1.0
- 61.5
|
|
SR10
|
0.14
|
0.01
- 0.25
|
0.002
|
0.001
- 0.006
|
3.6
|
1.0
- 32.5
|
|
SR12
|
0.13
|
0.01
- 0.23
|
0.002
|
0.001
- 0.006
|
3.0
|
1.0
- 17.5
|
|
SR15
|
0.14
|
0.01
- 0.25
|
0.003
|
0.001
- 0.006
|
8.6
|
1.0
- 48.0
|
Table 3.7 -
Photographic view of the water quality monitoring stations
|
Station
|
Site
condition during baseline monitoring
|
|
CE
|
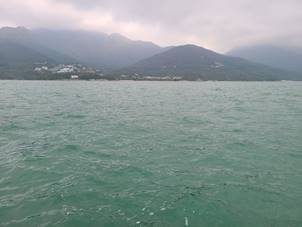
|
|
CF
|
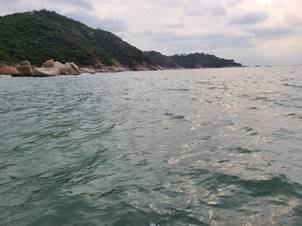
|
|
SR4
|
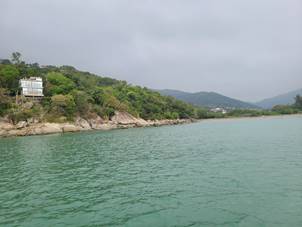
|
|
SR5
|
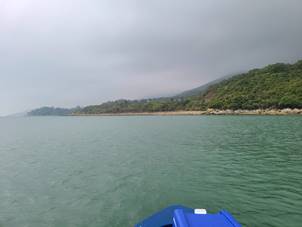
|
|
SR6
|
|
|
SR9
|
|
|
SR10
|
|
|
SR12
|
|
|
SR15
|
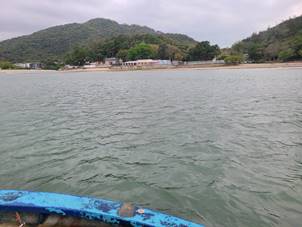
|
3.7.3
Reviewing the monitoring results, one highest value in suspended solid
(SR6 at 134.9mg/L) and two highest values in E.coli. (135cfu/100ml at SR4, 106cfu/100ml at SR6) were reviewed.
3.7.4
Checked the baseline monitoring results, suspended solid at 134.9mg/L of SR6 subject to abnormal turbulence
resulting in higher bottom SS captured during the baseline monitoring is
considered as outliner and discarded in Action and Limit Level calculation.
3.7.5 For the two extraordinary high values in E.coli., 135cfu/100ml at SR4 could be
due to SR4 is located at the downstream of 2 streams surrounding the existing
San Shek Wan Village where only old septic system is available without sewerage
system such that occasional domestic effluent discharge from upstream could be
captured on some baseline monitoring days, whereas 106cfu/100ml at SR6 could be
due to the absence of sewerage system for existing Lower Cheung Sha public
village as well as the presence of nearby septic system of the existing Lower
Cheung Sha Public Toilet on coastal landside of SR6. Under this situation, occasions of high
values in E.coli. from upstream
source that captured during the baseline monitoring shall not be discarded.
3.8.1 Action and Limit Levels of water quality
monitoring have been set with reference to the criteria in the EM&A Manual
as shown in Table 3.8 below.
Table 3.8 Action and Limit Levels
for
Water Quality
|
Parameters
|
Action
Level
|
Limit
Level
|
|
Construction
Phase Marine Water Monitoring
|
|
DO in mg/L
|
Surface and Middle
5%-ile of baseline data for surface and middle layer
Bottom
5%-ile of baseline data for bottom layers
|
Surface and Middle
4 mg/L
Bottom
2 mg/L
|
|
Turbidity in NTU
(Depth-averaged a) c
|
95%-ile of baseline data, or
20% exceedance of value at any impact station compared with
corresponding data from control station
|
99%-ile of baseline data, or
30% exceedance of value at any impact station compared with
corresponding data from control station
|
|
SS in mg/L
(Depth-averaged a) c
|
95%-ile of baseline data, or
20% exceedance of value at any impact station compared with
corresponding data from control station
|
99%-ile of baseline data, or
30% exceedance of value at any impact station compared with
corresponding data from control station
|
|
Operation Phase Marine Water Monitoring
|
|
Dissolved oxygen in mg/L b
|
Surface and Middle
5%-ile of baseline data for surface and middle layer
Bottom
5%-ile of baseline data for bottom layers
|
Surface and Middle
4 mg/L
Bottom
2 mg/L
|
|
Turbidity in NTU (Depth-averaged a) c
|
95%-ile of baseline data, or
20% exceedance of value at any impact station compared with
corresponding data from control station
|
99%-ile of baseline data, or
30% exceedance of value at any impact station compared with
corresponding data from control station
|
|
SS in mg/L (Depth-averaged a) c
|
95%-ile of baseline data, or
20% exceedance of value at any impact station compared with
corresponding data from control station
|
99%-ile of baseline data, or
30% exceedance of value at any impact station compared with
corresponding data from control station
|
|
5-day Biochemical Oxygen Demand in mg/L (Depth-averaged a) c
|
95%-ile of baseline data, or
20% exceedance of value at any impact station compared with
corresponding data from control station
|
99%-ile of baseline data, or
5 mg/L
|
|
Total Inorganic Nitrogen in mg/L (Depth-averaged a) c
|
95%-ile of baseline data
|
99%-ile of baseline data, and
0.1 mg/L
|
|
Unionized Ammonia in mg/L (Depth-averaged a) c
|
95%-ile of baseline data
|
99%-ile of baseline data, or
0.021 mg/L
|
|
E. coli
in cfu per 100 ml
(Depth-averaged
a) c
|
95%-ile of baseline data, or
20% exceedance of value at any impact station compared with
corresponding data from control station
|
(i) 99 %-ile of baseline or 610 cfu/100mL as
geometric mean for secondary contact, recreation subzones
(ii) 99 %-ile of baseline or 180 cfu/100mL as
geometric mean for bathing beach subzones.
|
|
Notes:
a. “Depth-averaged” is calculated by taking the arithmetic means
of reading of all three depths.
b. For DO, non-compliance of the water quality limits occurs
when monitoring result is lower than the limits.
c. For SS, turbidity, 5-day Biochemical Oxygen Demand, Total
Inorganic Nitrogen, Unionized Ammonia and E. coli, non-compliance of
the water quality limits occurs when monitoring result is higher than the
limits.
|
3.8.2
With the use of baseline water quality monitoring data, the action and limit level for impact stations
(i.e. SR4, SR5, SR6, SR9, SR10, SR12 and SR15) are derived.as presented in Table
3.9. Action Level and Limit Level
with 95-ile / 99-ile were derived from baseline water quality data “and” 20% /
30% exceedance of control station would be proposed in Section 5.1.1 based on the
sensitivity analysis of control station criteria presented in Appendix K which revealed the
following,
a) In
the sensitivity analysis, the 20% / 30% exceedance of control station criteria
required for the water quality parameters turbidity, SS, BOD5 and E. coli. were
derived and compared with percentiles of these parameters for testing its
sensitivity with the baseline monitoring data.
b) On
applying “OR” criteria, sensitivity analysis revealed that the 20% / 30%
exceedance would result in daily exceedances on turbidity and SS at various
impact stations with substantial percentage of non-project related exceedance anticipated
(up to 64.3% for turbidity and up to 73.8% for SS) even under the baseline
water quality condition as compared with the 95%-ile / 99%-ile derived with
within 5% of exceedance reported.
c) Similar
situation was also noted in the reported exceedance on BOD5 and E. coli. at
various impact stations with substantial numbers of non-project related
exceedance anticipated (up to 26.2% for BOD5 and up to 28.6% for E. coli.) even
under the baseline water quality condition reported within the monthly
monitoring period as compared with the 95-ile / 99-ile derived with is within
5% of exceedance reported.
d) On
applying “OR” criteria, the 20% / 30% exceedance of control station criteria
would make in the derived Action/Limit Levels (ALs/LLs) over-sensitive and ineffective
in monitoring the water quality impact for both construction and operation
phases due to percentage of non-project related exceedance anticipated. Adopting “AND” approach with 95%-ile /
99%-ile in the ALs/LLs could counter-balance the over-sensitivity effect as
reflected from similar percentage at around 5% of exceedance anticipated.
e) In
order to eliminate such over-sensitivity and the substantial numbers
non-project related exceedances reported impairing the effectiveness of the
EM&A programme, it is proposed to amend "OR" to "AND"
for the AL/LL of turbidity and SS, AL of BOD5 and AL of E.coli respectively as
referred to Note D of Table 3.9.
3.8.3
LLs of BOD5, TIN and UIA - the
justifications for the proposed amendments to the LLs are provided in Notes E,
F and G of Table 3.9.
Table 3.9 Derived Action and Limit levels
|
Parameters
|
Action Level
|
Limit Level
|
|
Construction Phase Marine Water Monitoring
|
|
DO in mg/L
B
|
Surface and Middle: 5.8 mg/L
Bottom: 5.9 mg/L
|
Surface and Middle: 4 mg/L
Bottom: 2 mg/L
|
|
Turbidity
in NTU
(Depth-averaged A) C
|
14.4 NTU and
20% exceedance of value at any impact station
compared with corresponding data from control station D
|
23.5 NTU and
30% exceedance of value at any impact station
compared with corresponding data from control station D
|
|
SS in mg/L
(Depth-averaged
A) C
|
13.1 mg/L and
20% exceedance of value at any impact station
compared with corresponding data from control station D
|
30.4 mg/L and
30% exceedance of value at any impact station
compared with corresponding data from control station D
|
|
Operation Phase Marine Water
Monitoring
|
|
Dissolved oxygen in mg/L B
|
Surface and Middle: 5.8 mg/L
Bottom: 5.9 mg/L
|
Surface and Middle: 4 mg/L
Bottom: 2 mg/L
|
|
Turbidity in NTU (Depth-averaged
A) C
|
14.4 NTU and
20% exceedance of value at any impact station
compared with corresponding data from control station D
|
23.5 NTU and
30% exceedance of value at any impact station
compared with corresponding data from control station D
|
|
SS in mg/L (Depth-averaged A) C
|
13.1 mg/L and
20% exceedance of value at any impact station compared
with corresponding data from control station D
|
30.4 mg/L and
30% exceedance of value at any impact station
compared with corresponding data from control station D
|
|
5-day Biochemical Oxygen Demand in mg/L
(Depth-averaged A) C
|
2.2 mg/L and
20%
exceedance of value at any impact station compared with corresponding data
from control station D
|
5 mg/L E
|
|
Total Inorganic Nitrogen in mg/L
(Depth-averaged A) C
|
0.23 mg/L
|
0.25 mg/L F
|
|
Unionized Ammonia in mg/L (Depth-averaged A) C
|
0.006 mg/L
|
0.021 mg/L G
|
|
E. coli
in cfu per 100 ml
(Depth-averaged A) C
|
31.0 cfu per 100 ml L and
20%
exceedance of value at any impact station compared with corresponding data
from control station D
|
(i) 61.1 cfu per 100 ml, or 610 cfu/100mL as geometric mean for secondary contact,
recreation subzones H
(ii) 61.1 cfu per 100 ml, or 180 cfu/100mL
as geometric mean for bathing beach subzones H
|
|
Notes (with proposed
amendments in AL/LL in underlined text):
A. “Depth-averaged” is
calculated by taking the arithmetic means of reading of all three depths.
B. For DO,
non-compliance of the water quality limits occurs when monitoring result is
lower than the limits.
C. For SS, turbidity,
5-day Biochemical Oxygen Demand, Total Inorganic Nitrogen, Unionized Ammonia
and E. coli, non-compliance of the water quality limits occurs when
monitoring result is higher than the limits.
D. Action Level and Limit
Level with 95%-ile / 99%-ile derived from baseline data “and” 20% /
30% exceedance of control station proposed in Section 5.1.1 justified with the
sensitivity analysis of control station criteria detailed in Section 3.8.2.
E. 99%-ile of baseline BOD5
data is 2.7 mg/L, which is considered too close to the proposed action level
of 2.2 mg/L. False alarm would be easily triggered if 2.7 mg/L is adopted as
limit level. Thus, 5 mg/L of criterion is adopted as limit level.
F. 99%-ile of baseline TIN
data is 0.25 mg/L. Owing to and-clause conditions, 0.25 mg/L is adopted as
limit level.
G. 99%-ile of baseline UIA
data is 0.006 mg/L, which is same as the proposed action level. In order to
avoid ambiguity of triggering action and limit level, 0.021 mg/L is
adopted as limit level for effective implementation of event and action
plan.
H. Referring to Table 4.1
of the EIA report, for secondary contact recreation subzones, the level
of Escherichia coli should not exceed 610 per 100 milligrams
per litre, calculated as the geometric mean of all samples collected in one
calendar year. While, for bathing beach subzones, the level of Escherichia
coli should not exceed 180 per 100 milligrams per litre,
calculated as the geometric mean of all samples collected from March to
October inclusive in one calendar year. Samples should be
taken at least 3 times in a calendar month at intervals of between 3 and
14 days.
|
2.
2.1.
2.1.1.
4.1.1 In accordance with Section 9 of EM&A
Manual under the approved EIA report (Register No. AEIAR-210/2017) requirement, a baseline monitoring
report shall be prepared to check, record and re-confirm the status of the Landscape
Resources (LR) and Landscape Character Areas (LCA) within the works area. The
report shall review the proposed mitigation measures and assess their
feasibility with reference to the operational requirements of the detailed
project works. Any potential conflicts between proposed mitigation measures and
the proposed works shall be resolved at an early stage (prior to construction)
and any necessary changes to the mitigation measures shall be incorporated into
the detailed design.
3.
3.1.
3.1.1.
4.2.1 The approved EIA Report (Register No. EIA-210/2017) – Outlying Islands Sewerage Stage 2 –
South Lantau Sewerage Works has been reviewed to extract relevant information
about the baseline conditions of the LRs and LCAs within and immediately
adjacent to, the construction and works areas during the EIA stage.
4.2.2 At the EIA stage, three LRs were
identified within the Project site which was identified as Woodland (LR1), Plantation
(LR3) and Urban/ Village Area (LR5). Two LCAs were identified as South Lantau
Coastal Uplands and Hillsides (LCA1) and South Lantau Coastal Settled Valleys
(LCA2) Description of the baseline conditions of the above three LRs and two LCAs
in approved EIA report are as follows:
-
LR1 – Woodland: This LR consists of large areas of trees growing
mainly on the upland and hillside areas, but also some areas closer to the
shore at lower elevations. These woodlands vary in maturity and have
a canopy height ranging between 5-12 m on average. Species vary in
different areas but are dominated by a mixture of native pioneer species
including Schefflera heptaphylla, Sapium sebiferum, Claoxylon
indicum, Zanthoxylum avicennae, backshore species including Hibiscus
tiliaeceus and Pandanus tectorius. This LR also includes some
relatively old woodland behind Shui Hau, Tong Fuk, Ham Tin
and Pui O villages, in which woodlands
behind Shui Hau and Tong Fuk are recognised as
Fung Shui woodland by AFCD (Figures
5.4a-m), giving it high local significance. Species in these
areas include Aquilaria sinensis, Schefflera heptaphylla, Ficus variegata, Cinnamomum camphora and Aporusa dioica.
Whilst this LR is common in Hong Kong, it is of high conservation value due to
its naturalness and undisturbed nature, and some areas are protected as they
fall inside the Lantau South Country Park and Green Belt. This LR is
thus of high local importance and high quality. Overall this LR is
relatively intolerant to change and its sensitivity is high.
-
LR3 – Plantation: This LR contains planted trees
and is largely located along roadsides, within and around developed areas and
above catch water although there is also a large area east of San Shek Wan and
Pui O Wan from the coast up to the catch water of the Lantau Trail. Most trees
in this LR are exotic species, including Acacia confusa, Casuarina
equisetifolia and Pinus elliotii. This LR is common in Hong Kong,
and those areas that are protected as Lantau South Country Park, Green Belt and
Coastal Protection Areas are considered to be of conservation value. This is an
LR planted by man and despite its tall canopy the plantation is considered
relatively immature and of medium quality, and its overall sensitivity is
medium.
-
LR5 – Urban/ Village Area: This LR includes the
villages of Shui Hau, Tong Fok, Cheung Sha, San Shek Wan, Pui O and Ham Tin as
well as the penal institution at Tong Fuk and large areas of modified landscape
such as that near the junction of the new Tung Chung Road with South Lantau
Road. It also includes South Lantau Road itself and the new and old Tung Chung
Roads as well as the cemented landing site at Tong Fuk and the road leading
down to this. This LR is mainly modified but has some vegetation including
village trees and private amenity planting which, along with the traditional
village houses and ancestral halls also found within this LR, are vulnerable to
the change. This LR is common in Hong Kong and of low conservation value.
Overall this LR has limited greening, is low to medium quality and has a
reasonable tolerance to change. Its overall sensitivity is considered medium.
-
LCA1 – South Lantau Coastal Uplands and Hillsides:
This LCA comprises uplands and hillsides adjacent to the coast between the Lo
Kei Wan and Chi Ma Wan peninsulas, predominantly lying below 300 mPD and going
down to sea level in some areas. There are almost no built forms in this LCA,
which is highly vegetated by relatively mature scrubland, woodland and some
patches of plantation. Whilst this LCA is common in Hong Kong, it is of high
conservation value due to its naturalness and undisturbed nature, and some
areas are protected as they fall inside the Lantau South Country Park and Green
Belt. This LCA is of high quality with limited ability to accommodate change
and its sensitivity is considered to be high.
-
LCA2 – South Lantau Coastal Settled Valley: This
LCA is composed of valleys where they meet the sea mainly around river or
stream estuaries. It is populated by scattered low-rise villages and buildings
with easy access to the sea and generally has low-lying topography. This LCA
has significant human settlement i.e. is developed, but also has significant
vegetation including some woodland and plantation of varying maturity, as well
as small areas of agricultural lands and marsh. This LCA is common in Hong
Kong, and those areas that are protected as Lantau South Country Park, Green
Belt and Coastal Protection Areas are considered to be of conservation value.
This LCA is considered to be of medium quality due to the amount of development
it contains which makes it adaptable to change and its sensitivity is
considered to be medium.
4.2.3 As illustrated in Fig. 1.2, LR3, LR5 and
LCA2 are potentially affected by Pui O Sewage Pumping Station (POSPS); LR1, LR5 and LCA2 are potentially affected
by San
Shek Wan Sewage Treatment Works (SSWSTW) and LR5 is potentially affected by pipe works under this
Contract. The
estimated total affected areas are in line with Table 10.3 of EIA report.
4.
4.1.
4.1.1.
4.3.1 Tree Preservation and
Removal Proposal (TPRP) for the project of Outlying Islands Sewerage Stage 2 –
South Lantau Sewerage Works and Other Works – Design and Construction dated
March 2020 was approved. The approval TPRP has been reviewed to extract relevant information
about the baseline conditions of relevant landscape resources of the area covering Pui O
Sewage Pumping Station (POSPS), San Shek Wan Sewage Treatment Works (SSWSTW)
and Pui O Lo Uk Tsuen.
-
Section 8.1.1 - A total of 362 tree specimens
including 10 exotic species (91 trees), 32 local species (247 trees) and 24
dead trees were identified and surveyed at the proposed site of SSWSTW, POSPS
and Pui O Lo Uk Tsuen. Because of provisioning of space for building SSWSTW and
POSPS and the limited space for compensatory trees, a total of 276 (36 trees at
POSPS, 238 trees at SSWSTW and 2 trees at Lo Uk Tsuen) trees within the project
area have been recommended for felling under Package 1. 80 trees are retained
(60 trees at POSPS and 20 trees at Pui O Lo Uk Tsuen) and 6 trees will be
transplanted (4 trees at SSWSTW and 2 trees at POSPS).
-
Section 8.1.2 - The compensatory planting of a
ratio similar to 1:1 in terms of number, i.e. total 276 trees will be implemented
on-site to compensate for the loss of trees in Package 1 commencing in end-2020
for completion in end-2026.
4.3.2
The updated tree survey was carried out from 6 July
2021 to 30 August 2021 and 14 January 2022. The total no. of trees was 574 are
recorded within the Project site and 397 trees are affected based on the
refined design of the San Shek Wan Sewage Treatment Works and roadworks taking
into account the actual topographic situation and future operational needs. The
nos. of affected trees in LR3 and LR5 at POSPS is 115 and 281 trees in LR1 and
LR5 at SSWSTW and 1 tree in LR5 at pipe works are affected. The additional affected trees will be covered in revised
TPRP and details of mitigation will be elaborated in Landscape Mitigation Plan
to be submitted as per condition 2.14 of EP-538/2017.
5.
5.1.
5.1.1.
4.4.1 Baseline monitoring for the existing
landscape condition was conducted on 9 February 2021. During the baseline
monitoring, LR and LCA covered within
works areas in Contract No. DC/2020/02 (the Contract) have been conducted. Location of the Project Site is shown
in Appendix G.
4.4.2
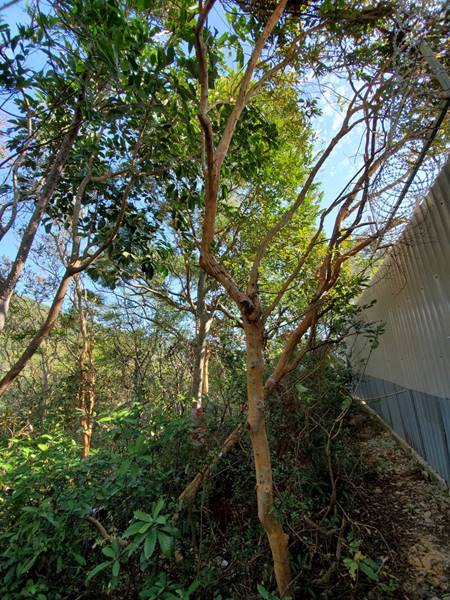
LR1 –
Woodland: Trees species in San Shek Wan Sewage Treatment Works (SSWSTW) include
mixture of native pioneer species including Schefflera
heptaphylla, Sapium sebiferum, Claoxylon indicum, Zanthoxylum avicennae.
The dominant species are Acacia confusa. Aporusa dioica and Alangium chinense.
In addition, 3 nos. of Gmelina chinensis
and 2 nos. of Aquilaria sinensis are identified within the proposed
boundary of SSWSTW which is rare and precious plant. The condition of LR1 is consistent with the baseline
conditions described in Section 10.6.4 and 10.6.6 of
the approved EIA report. Photographic view of the existing conditions of LR1 as
shown in Table 4.1.
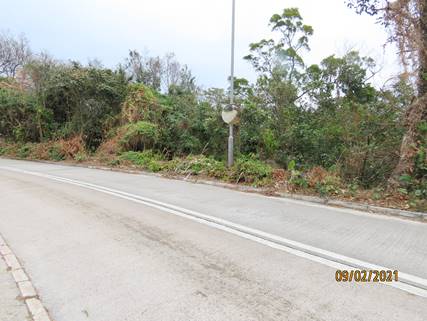
4.4.3 LR3 – Plantation: Planted
trees were observed along roadsides, within and around developed areas in the
area of San Shek Wan and Pui O Wan. Exotic species were found, including Acacia
confusa, Casuarina equisetifolia and Pinus elliotii. In Pui O Sewage Pumping Station (POSPS) the
dominant species are Celtis sinensis and Acacia
confusa while in SSWSTW the dominant species are Acacia confusa and Pinus massoniana.
The condition of LR3 is consistent with
the baseline conditions described in Section 10.6.4 and 10.6.6 of the approved
EIA report. Photographic view of the existing conditions of LR3 as shown in Table
4.1.
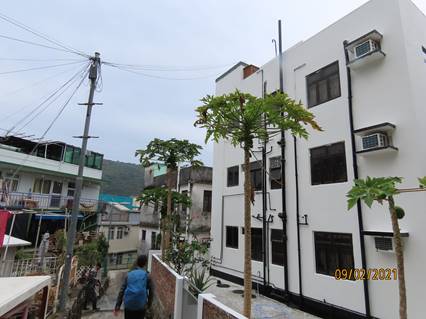
4.4.4 LR5 – Urban/ Village Area: Low-density
villages of San Shek Wan and Pui O were observed near South Lantau Road. Vegetation,
including village trees and private amenity planting, was found along with
traditional village houses and ancestral halls. The condition of LR5 is generally similar
with the baseline conditions described in Section 10.6.4 of the approved EIA
report. Photographic view of the existing conditions of LR5 as shown in Table
4.1.
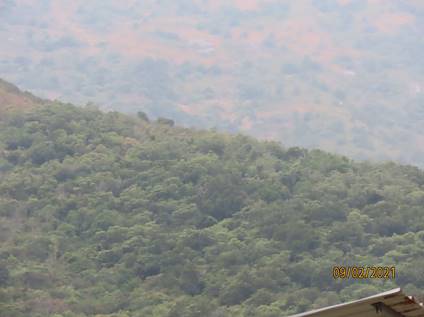
4.4.5 LCA1 – South Lantau Coastal
Uplands and Hillsides: Uplands and hillsides were observed with highly
vegetated by relatively mature scrubland, woodland and patches of plantation.
Naturalness and undisturbed nature of the Lantau South Country Park and Green
Belt placed high conservation value. The condition of LCA1 is consistent with the baseline conditions
described in Section 10.6.3 of the approved EIA report. Photographic view of
the existing conditions of LCA1 as shown in Table 4.1.
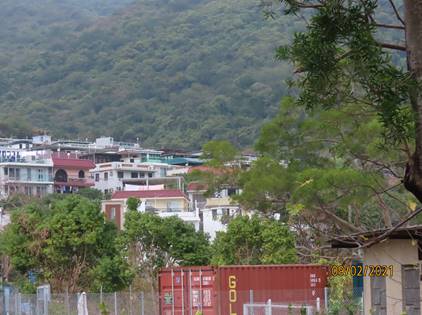
4.4.6 LCA2 – South Lantau Coastal
Settled Valley: Scattered low-rise villages and buildings with easy access to
the sea on a low-lying terrain were observed. Woodland with plantation of
varying maturity, small areas of agricultural lands and marsh were also found
in Lantau South Country Park, Green Belt and Coastal Protection Areas. The dominant backshore species in POSPS are Excoecaria agallocha, Thespesia populnea
and Pandanus tectorius.The condition of LCA2 is generally similar with the baseline conditions
described in Section 10.6.3 and 10.6.6 of the approved EIA report. Photographic
view of the existing conditions of LCA2 as shown in Table 4.1.
4.4.7 The photographic record and monitoring
results are shown in Table 4.1. Key plan showing the location and extent
of existing landscape and visual resource is shown in Appendix H. Compared to the findings in the approved
EIA report, the status of the LRs and LCAs covered in SSWSTW and pipe works remain unchanged; while the
updated LR and LCA plans for the revised layout of POSPS is shown in Appendix I. And trees will be transplanted and
compensated according to the approved TPRP. Since there is no major change in
the landscape and visual baseline conditions comparing to those of the EIA
stage, additional landscape and visual mitigation measures would be subjected
to revised TPRP, if any. Details of mitigation measure will be covered in
Landscape Mitigation Plan.
4.4.8 Baseline of other LR and
LCA will be supplemented under separate submission(s) to capture the baseline
condition of the corresponding part(s) under other contracts when corresponding
work areas, detailed project works and landscape design become available for
review as per EM&A manual Section 9.
|
Existing Landscape Resources within Works Area
|
Photographic Record
|
|
LCA1 – South Lantau
Coastal Uplands and Hillsides
|
|
|
LCA2 – South Lantau
Coastal Settled Valley
|
|
|
LR1 – Woodland
|
|
|
LR3 – Plantation
|
|
|
LR5 – Urban/ Village Area
|
|
3.6
5.1.1
Reveiwing the sensitivity analysis of control
station criteria as referred to Section 3.8.2, the application of 20% / 30%
exceedance of control station criteria alone would make in the derived
Action/Limit Levels (ALs/LLs) over-sensitive and ineffective in monitoring the
water quality impact for both construction and operation phases. Adopting the “and” approach with 95%-ile /
99%-ile in the ALs/LLs could counter-balance the over-sensitivity effect. In order to eliminate such over-sensitivity
and the substantial numbers non-project related exceedances reported impairing
the effectiveness of the EM&A programme, it is proposed to amend
"or" to "and" for the AL/LL of turbidity and SS, AL of BOD5
and AL of E.coli respectively.
5.1.2
Standard method of APHA 2540E was mentioned in
Table 5.2 of the EM&A Manual for testing suspended solid (SS); whereas, the
APHA 2540E method is for testing volatile and fixed suspended solids rather
than total suspended solid. Thus, the standard method of APHA 2540D for testing
total suspended solid should be employed in Table 5.2 of the EM&A Manual.
5.1.3
In view of the above method update, reporting limit
of SS in Table 5.2 of the EM&A Manual was reviewed. According to baseline
water quality monitoring data, the vast majority of SS concentration is equal
to or larger than 2 mg/L, only with around 7% of data ranging below 2 mg/L.
Increase in reporting limit from 1 mg/L to 2 mg/L would not greatly influence
the accuracy of SS result and implementation of event and action plan against
action and limit levels. In addition, the reporting
limit of 2 mg/L has been adopted in the project of Expansion of Hong Kong
International Airport into a Three-Runway System. In light of precedent case,
adoption of 2 mg/L as SS reporting limit in monitoring during construction
phase and operational phase is proposed in Table 5.2 of the EM&A Manual.
5.1.4
Due to insufficient water for sampling and safety
issue associated with hard rocks and shallow water, water quality monitoring
stations of SR4, SR9 an SR12 were proposed to be fine adjusted as per EP
Condition 3.1, and baseline water quality monitoring was conducted at the fine
adjusted location accordingly. The proposal of fine adjustment of water quality
monitoring stations was submitted in a separate proposal for EPD’s approval. In
light of valid data as checked, the mentioned stations presented in Appendix E should be followed in the future monitoring during
construction and operation phase under EM&A programme.
5.1.5
Baseline
water quality monitoring was carried out in 4-week period which could not
account for all site conditions under seasonal variation in particular the
safety concern in marine navigation during windy conditions due to monsoon in
winter (i.e. dry season) or weather conditions with typhoons/thunderstorm in
summer (i.e. wet season) outside baseline monitoring period. Safety consideration for conducting water
sample “surrounding water quality monitoring station” are considered essential
and necessary to allow minor adjustment on proposed monitoring locations for
impact monitoring.
5.1.6
Reviewing the 3 monthly intervals throughout all
stages of the water quality monitoring as per Section 3.2.7 in Appendix-D2:
General Technical Requirements of Environmental Monitoring of Guidelines for
Development Projects in Hong Kong and typical EM&A requirements of current
projects with water quality monitoring (e.g. Expansion of Hong Kong
International Airport into a Three-Runway System, Tung Chung New Town
Extension), 3 monthly intervals calibration is proposed as re-calibration
frequency for water quality monitoring.
5.1.7
With reference to Appendix C, fine adjusted noise monitoring locations as
proposed per EP Condition 3.1 are suggested in Figure 4.1 to Figure 4.8 of the
EM&A manual. The proposal of fine adjustment of noise monitoring stations was
submitted in a separate proposal for EPD’s approval. It is also recommended
that the noise and water quality monitoring station condition should be
regularly reviewed and fine adjustment or relocation may be needed in order to
obtain respective impact monitoring results.
5.1.8
Regarding Section 4.1.3 of the EM&A Manual, one
set of Leq(15min) noise as three consecutive Leq(5min)
shall be monitored during impact monitoring. However, since construction noise
during night time and restricted hour is regulated under Construction Noise
Permit (CNP) system rather than actual numerical criteria as per Table 1B of
Annex 5 under Technical Memorandum on Environmental Impact Assessment Process.
Hence, impact noise monitoring in restricted hours is suggested to be erased in
the EM&A Manual, and implementation of CNP will be checked and audited
during construction phase instead.
Water Quality
6.1.1 Baseline water quality monitoring was conducted at the
dry season due to tight schedule of commencement of the Project. To account for
more representative baseline water quality to cover the wet season and seasonal
variations, it is recommended that baseline conditions should be reviewed
quarterly when appropriate, through review the monitoring effectiveness and
improve the EM&A programme as per Section 12.3(m)
under the EM&A Manual for IEC verification.
6.1.2 Monitoring works shall not be conducted during adverse
weather, including strong monsoon signal, tsunami warning, thunderstorm
warning, amber / red / black rainstorm signal, tropical cyclone warning signal No.
3 or higher, in order to ensure personnel safety and avoid acquisition of
unrepresentative data and subsequent false alarm.
Noise sources
6.1.3 The works area of Contract No. DC/2020/02 covers part
of the assessment area (i.e. San Shek Wan and Pui O) of the Outlying Islands
Sewerage Stage 2 – South Lantau Sewerage Works. Construction impact
monitoring for the Contract will be at most conducted at Fine Adjusted N12a, Fine
Adjusted N12b, Fine Adjusted N13, Fine Adjusted N15b, Fine Adjusted N16a, Fine
Adjusted N16b and Fine Adjusted N17, because the above monitoring stations are
located within a radius of 300m from contract-related works areas as
illustrated in Appendix J. The above monitoring stations are expected
representative for the works area of the Contract. Since contract-related construction activities
would be carried out phase by phase, impact noise monitoring will be conducted
at designated stations only when the activities fall within a radius of 300m
from corresponding monitoring stations, according to Section 4.1.2 of the
EM&A Manual.
6.1.4 For Fine Adjusted N14 (South Lantau Community Centre),
during site visit on 9 Feb 2021 the door of the facility was observed broken
and the facility was seemed vacant. The facility is considered abandoned.
According to the Outline Zoning Plan and desktop study, there was no record for
planning application and revitalization plan of South Lantau Community Centre.
Thus, N14 does not consider as noise sensitive receiver, and impact noise
monitoring for N14 would not be necessary unless occupants are observed in the
future.
6.1.5 Baseline noise monitoring was conducted prior to commencement
of construction works. During baseline monitoring period, no construction
activities were observed. The major noise source was traffic noise and
community noise nearby monitoring station. It is possible that same noise
sources would be identified during impact monitoring period. It is recommended
that noise monitoring station condition should be regularly reviewed when
appropriate, and fine adjustment or relocation may be needed in order to obtain
respective impact monitoring results.
Landscape and Visual
6.1.6 Although there is no major change in the
landscape baseline conditions comparing to those presented in the EIA report
and the TPRP, it is recommended to review landscape and visual mitigation
measures regularly to ensure sufficient protection against project
implementation.
Conclusion
6.1.7 In accordance with the Project EM&A Manual and EP,
baseline monitoring has been undertaken prior to commencement of the
construction works of the Contract for the following baseline monitoring
components: Noise; Water Quality and Landscape.
6.1.8 As mentioned under
Appendix C and Appendix E, several fine adjustments of locations were proposed
for baseline noise and water quality monitoring.
Nevertheless, given the fine adjusted location with similar pollution sources
and similar condition to the original locations recommended in the EM&A
manual, it is considered to be representative for the noise and water sensitive
receiver identified in EM&A manual.
6.1.9 Baseline noise monitoring was conducted at sixteen (16)
monitoring stations in three batches from 2 March 2021 to 22 April 2021. The
major noise sources identified at the monitoring station are traffic noise and
community noise. The baseline monitoring results are considered representative
of the ambient noise level.
6.1.10
Baseline
water quality monitoring was conducted at nine (9) monitoring stations from 3
March to 29 March 2021. No observable pollution source was recorded at the
monitoring stations and the baseline monitoring results are thus considered
representative of the ambient water quality levels. Action and Limit Levels
were established for parameters based on the baseline monitoring results.
6.1.11 Baseline monitoring for
existing landscape and visual condition was conducted on 9 February 2021. The status
of the LRs and LCAs covered in the works area of Contract No. DC/2020/02 generally
in line with the approved EIA report. Baseline of other LR and LCA will be
supplemented under separate submission(s) to capture the baseline condition of
the corresponding part(s) under other contracts when corresponding work areas,
detailed project works and landscape design become available for review as per
EM&A manual Section 9.